
A Likert scale measures attitudes, opinions, or perceptions using ordered response options, such as “strongly disagree” to “strongly agree.” Strictly speaking, a single statement is a Likert-type item, while a Likert scale combines several related items.
How Does a Likert Scale Work? An Example
Consider this statement: “I can identify the research question in a journal article.” Respondents choose strongly to disagree, disagree, neither agree nor disagree, agree, or strongly agree.
You might code those choices 1–5. A response of 4 records agreement; it does not establish the respondent’s actual reading ability. Several related statements could contribute to a perceived research-reading confidence score, but only after the proposed interpretation is evaluated.
This is the practical Likert scale definition: ordered responses capture a reported position, while an appropriate set of items may measure a broader construct. Rensis Likert’s 1932 monograph, A Technique for the Measurement of Attitudes, developed a summated approach to attitude measurement. Modern variants extend beyond its original formats.
When to Use Likert Scale Questions
Use Likert scale questions when a simple yes-or-no response would hide how strongly a respondent feels. They are most useful for measuring attitudes, satisfaction, confidence, agreement, or perceived quality, constructs that cannot be observed directly.
For example, asking customers whether they are satisfied with a product gives only two possible answers. It cannot show whether they were mildly pleased, neutral, or very disappointed.
A Likert-type scale question captures that variation by asking:
How satisfied are you with the product you purchased?
- Very dissatisfied
- Dissatisfied
- Neither satisfied nor dissatisfied
- Satisfied
- Very satisfied
This scale 1 to 5 format reveals the direction and intensity of the response. It helps you distinguish between a customer who is only slightly satisfied and one who is highly satisfied, even though both would answer “yes” to a basic satisfaction question.
Choose a rating scale in research when:
- You need more detail than a binary yes/no answer.
- You want to measure perceptions rather than objective facts.
- You need comparable responses across a defined group.
- You want to identify patterns in satisfaction, agreement, or importance.
- You need enough variation to support meaningful analysis.
A unipolar scale is suitable when the attribute has no opposite, such as satisfaction from “not at all satisfied” to “extremely satisfied.” A bipolar agreement scale, 7 point or 5 point, works when respondents can hold opposing views, such as “strongly disagree” to “strongly agree.”
Likert Scale vs. Likert-Type Item vs. Questionnaire
The item is the statement or question. The response format supplies the ordered categories. The questionnaire is the wider instrument, potentially containing several constructs, demographic questions, and open comments.
A multiple-choice rating scale is therefore not automatically a complete Likert measure. A numerical pain rating, a semantic differential between paired adjectives, and an agreement item belong to a broader family of rating formats, but should not be treated as identical instruments.
You may encounter the term “Likert-like scale.” It usually signals an adaptation; describe the actual items, labels, and scoring instead of relying on that label alone.
Likert Scale Examples for Research and Academic Surveys
These original survey scaling examples show what different response dimensions measure. They are teaching examples, not validated questions or results.
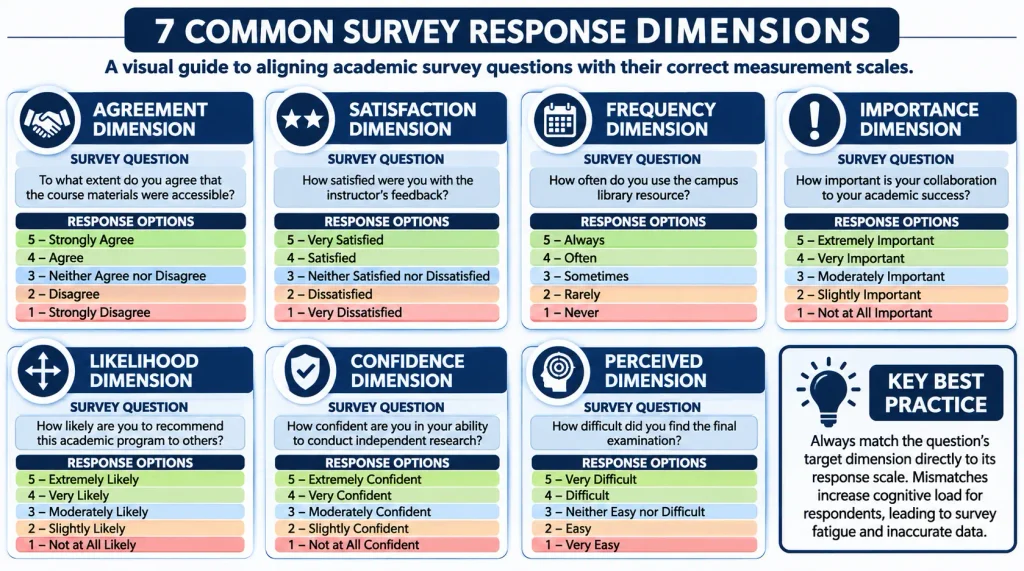
- Agreement: “The course explains how research claims should be supported.” Strongly disagree; disagree; neither agree nor disagree; agree; strongly agree. Measures agreement with a statement, not demonstrated knowledge.
- Satisfaction: “How satisfied or dissatisfied are you with access to required readings?” Very dissatisfied; dissatisfied; neither satisfied nor dissatisfied; satisfied; very satisfied. Measures a reported evaluation of access.
- Frequency: “During the past four weeks, how often did you check an article’s methods before citing it?” Never; rarely; sometimes; often; always. Measures reported frequency over a defined period, not an exact count.
- Importance: “How important is access to full text when choosing a database?” Not at all important; slightly important; moderately important; very important; extremely important. Measures perceived importance.
- Likelihood: “How likely are you to attend an optional citation workshop next month?” Very unlikely; unlikely; neither likely nor unlikely; likely; very likely. Measures intention, not future attendance. If coded 1–5, state that 1 means very unlikely and 5 means very likely; the numbers are not probabilities.
- Confidence: “How confident are you in recognizing an unsupported research claim?” Not at all confident; slightly confident; moderately confident; very confident; extremely confident. Measures perceived confidence rather than tested competence.
- Perceived difficulty: “How difficult was it to locate an article’s data-availability statement?” Not at all difficult; slightly difficult; moderately difficult; very difficult; extremely difficult. Ask only respondents who attempted the task.
These examples of Likert scale questions also illustrate a wording rule: response labels must answer the question asked. Agreement options do not fit a direct frequency question. The same rule applies when developing your own survey scale examples. These quantitative research examples connect such measures with broader study questions.
Example of a Likert Scale Questionnaire for Student Satisfaction
Research topic: Student Satisfaction
Instructions: Select one response for each statement based on your experience.
| Question | 1 | 2 | 3 | 4 | 5 |
| How satisfied are you with the quality of teaching? | Very dissatisfied. | Dissatisfied. | Neither satisfied nor dissatisfied. | Satisfied | Very satisfied |
| How satisfied are you with access to learning materials? | Very dissatisfied. | Dissatisfied. | Neither satisfied nor dissatisfied. | Satisfied | Very satisfied |
| feedback provided by instructors? | Very dissatisfied. | Dissatisfied | Neither satisfied nor dissatisfied. | Satisfied. | Very satisfied. |
Types of Likert Scale Formats and Response Options
Unipolar vs. Bipolar Likert Scales
A unipolar scale measures the amount of one attribute, from its absence to a high degree. “Not at all confident” to “extremely confident” is an example. Its middle category means a moderate amount, not neutrality between opposites.
A bipolar format spans two directions, such as dissatisfaction and satisfaction. Its middle can represent neither direction. The types of Likert scale questions commonly listed online agreement, satisfaction, frequency, importance, and confidence, describing response dimensions, not a single universally agreed classification.
Balanced and Unbalanced Likert Scale Response Options
Balanced bipolar categories provide comparable choices on both sides. “Poor, fair, good, very good, excellent” is not a balanced agreement set; it also uses a different evaluation dimension.
An unbalanced response set can encourage one-sided answers. Equally, equal numbers of favorable and unfavorable respondents are not a requirement for balanced questionnaire design.
5-Point vs. 7-Point Likert Scale
Both formats below are examples, not universal prescriptions. Select them through your construct, target respondents, prior instrument evidence, and pretesting.
| Format | Response categories | Strength | Limitation | Appropriate use |
| 5-point agreement | Strongly disagree; disagree; neither agree nor disagree; agree; strongly agree. | Relatively compact; includes meaningful neutrality. | May not distinguish between mild and stronger positions. | Where the audience can use five clear categories. |
| 7-point agreement | Strongly disagree; disagree; somewhat disagree; neither agree nor disagree; somewhat agree; agree; strongly agree. | Adds distinctions on each side of the midpoint. | Longer labels and additional choices can increase effort. | Where pretesting supports the finer distinctions. |
A seven-point agreement scale is not necessarily more accurate because it provides more options. Labels such as “somewhat” need testing. There is no standard “somewhat scale” independent of a construct: “somewhat likely” and “somewhat satisfied” describe different continua.
4-Point vs. 6-Point Likert Scale
An even-numbered bipolar format can omit neutrality. A four-point agreement version could use strongly disagree, disagree, agree, and strongly agree; a six-point version could add somewhat disagree and somewhat agree.
Use such formats only when omitting a neutral position is justified. Forcing a genuinely neutral person towards either side may create an opinion rather than measure it. More categories also cannot substitute for a relevant question.
How to Create Effective Likert Scale Questions
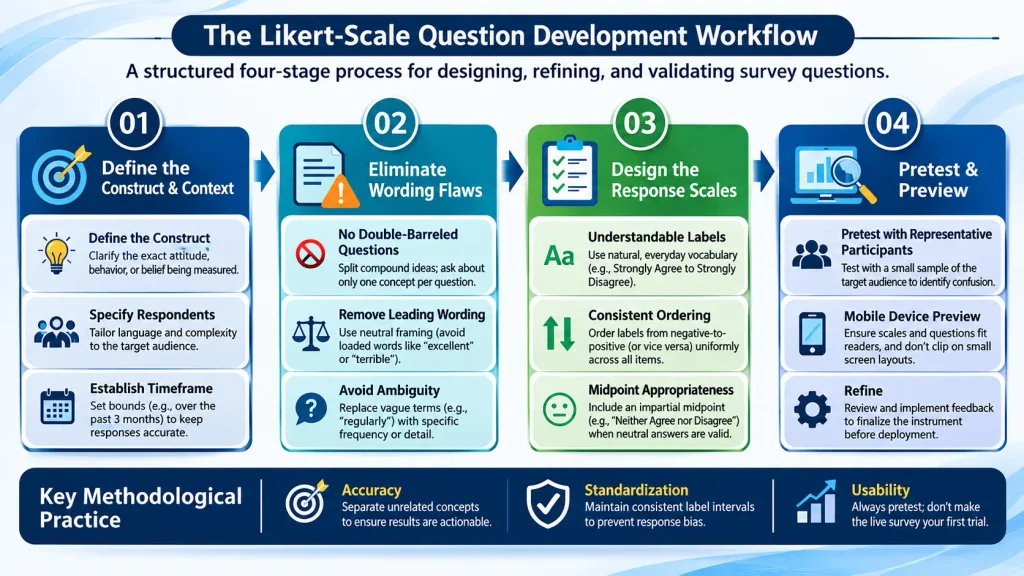
1. Define the Research Construct and Target Respondents
Decide whether you need perceived confidence, satisfaction, behavior, or an actual performance measure. Define the relevant population and timeframe. First, check whether an established measure fits your purpose; examine permissions and evidence for the intended population before adapting it.
2. Write Clear, Single-Idea Questions
Weak: “The library is convenient, and its training is excellent.”
Improved: “How satisfied are you with the library’s opening hours?” Ask about training quality separately.
The revision identifies one evaluable feature and provides a question that can receive matching satisfaction labels. Clear Likert-type scale questions avoid leading praise, emotional wording, double negatives, and assumptions about experiences participants may not have.
3. Choose Appropriate Response Options
Select understandable labels, a relevant midpoint if appropriate, and a consistent low-to-high direction. Do not insert additional favorable categories simply to make results look positive. Keep instructions brief and explicit about which period or experience respondents should consider. Keep ordinal categories in order rather than randomly shuffling their labels.
4. Pretest and Pilot Your Likert Scale Questionnaire
Ask people resembling the intended participants to explain the question and why they selected an answer. Revise ambiguous terms and check that the form works in its intended setting. A pilot should examine interpretation, not merely whether all fields have been completed. Preview the actual layout on participants’ likely devices, including phones.
Questionnaire Scaling – How to Design a Likert Scale Questionnaire
Group related Likert questions together and maintain the same labels when they measure the same response dimension. Avoid a long grid that encourages hurried pattern clicking. A Likert questionnaire may contain different constructs, but that does not justify one grand total.
When scaling a questionnaire, distinguish presentation from measurement. A rating scale in research must fit the concept and analytical plan; an attractive grid is not evidence of reliability or validity.
Study design is another separate decision. These types of quantitative research explain why a survey can be observational, cross-sectional, or longitudinal rather than a complete design label by itself.
Advantages and Disadvantages of Likert Scales
A Likert scale is practical because it turns perceptions into ordered responses that can be compared and analyzed. Its value depends on clear wording, an appropriate response range, and a research design that matches the question.
Advantages
- Measures attitudes in detail: Likert questions capture varying levels of agreement, satisfaction, importance, or confidence rather than reducing a response to yes or no.
- Supports quantitative analysis: Ordered responses can be summarised, compared across groups, and used to examine relationships between variables. Statistical testing should still match the data type and study design.
- Makes abstract concepts measurable: Statements about trust, usability, motivation, or service quality become recordable responses rather than vague impressions.
- Is quick for respondents: Closed-ended questions require less effort than open-ended questions, making them suitable for larger samples and shorter surveys.
- Enables comparison over time: Repeating the same items in later surveys can show whether satisfaction, confidence, or agreement changes.
- Works across many research settings: The format is widely used in academic research, employee feedback, customer research, education, and health-related surveys.
Disadvantages
- Responses can be biased: Respondents may avoid extreme options or give answers they believe will appear socially acceptable, especially on sensitive topics.
- Questions can be interpreted differently: Terms such as “often,” “fair,” or “somewhat” may mean different things to different people, reducing consistency between responses.
- Fatigue can affect accuracy: Long questionnaires may lead to rushed or inattentive answers, particularly when many items use a similar format
- Options may not fit every respondent: A respondent may feel that none of the available answers fully reflects their experience, especially if the scale is poorly designed.
- Scores require careful interpretation: A numerical response does not automatically prove that the difference between two adjacent options is equal in size.
- Design choices affect results: The number of points, inclusion of a neutral option, question wording, and item order can all influence how respondents answer.
How to Code and Score Likert Scale Responses
Code the categories consistently and retain a codebook linking values to labels. On 1–5 coding, a reverse-keyed response is commonly transformed as 6 minus the original score; follow the established instrument’s instructions. Reverse wording is not compulsory and can introduce confusion.
For a justified three-item measure, complete responses of 3, 4, and 5 sum to 12 and average to 4. This arithmetic alone does not demonstrate that the items belong together.
How to Analyze Likert Scale Data
Individual Likert-style responses are ordinarily ordinal: the order is known, but equal gaps between categories are not guaranteed. Start with category counts and percentages. A mode identifies the most common answer; a median identifies a middle ordered position, but neither replaces the full distribution.
For inference, ordered associations may suit Spearman correlation; independent-group comparisons may suit rank-based methods; ordinal regression may suit a modelled ordinal outcome.
Report uncertainty and relevant missingness. A score of 4 does not mean twice as much confidence as 2, and a small difference between averages does not establish a practically important effect.
How to Represent Data Through Likert Charts
A frequency chart shows the count or percentage in each ordered category. A 100% stacked bar combines categories within each item, allowing several items to be compared. A diverging stacked bar displays opposing response directions around a shared center. Explain how its neutral segment is positioned; a neutral response is not zero respondents.
Suppose an illustrative sample of 20 responses contains ten strongly disagree and ten strongly agree. Its numerical mean is 3, the same as twenty midpoint responses. One pattern is polarized; the other consistently selects the midpoint. These are hypothetical distributions, not study findings.
Likert Scale Research and Reporting Checklist
A well-designed Likert scale helps researchers measure attitudes, opinions, and perceptions through clear, structured response options. Before using one, confirm that your questions match the research construct, suit your target respondents, and provide meaningful response choices. Understanding the different types of research articles can also help you decide how to present your survey findings, whether as a substantive research study or an instrument-development paper.
Frequently Asked Questions
It uses ordered ratings to measure a reported attitude or perception. Strictly, a multi-item scale combines related responses into a justified measure.
It captures degrees of a reported position rather than only yes or no. It does not directly establish behavior or competence.
Agreement with a teaching statement and satisfaction with reading access are examples. Their labels should differ because they measure different response dimensions.
An item is one rated question or statement. A scale combines related items with appropriate measurement justification.
Individual responses are ordinal. Approximately interval treatment of a composite needs justification rather than a numeric label alone.
Seven offers additional distinctions within each direction. Neither format is universally better; respondents must be able to use its categories meaningfully.
It measures the amount of one attribute, such as from no confidence to very high confidence. Its midpoint need not mean neutrality.
Begin with counts and percentages. Choose further summaries or models according to the question, measurement properties, and whether items or composites are analyzed.
There is no universal minimum. Use enough appropriate items to cover the construct without unnecessary burden, and evaluate the proposed measure.